
Shipping an LLM feature is easy. Knowing whether it still works next week is the hard part. A prompt that costs $0.002 in a notebook costs real money at 100 million calls, a model upgrade silently changes behavior, and an agent that worked in testing starts looping in production. Without observability you find out from an angry customer, not a dashboard.
LLM observability platforms exist to close that gap. The good ones trace every call, version your prompts, track cost per user and per feature, run automated evaluations, and gate deployments on eval results. The category has split between drop-in proxies that are live in minutes, full open-source platforms you can self-host, and eval-first tools built around CI/CD quality gates.
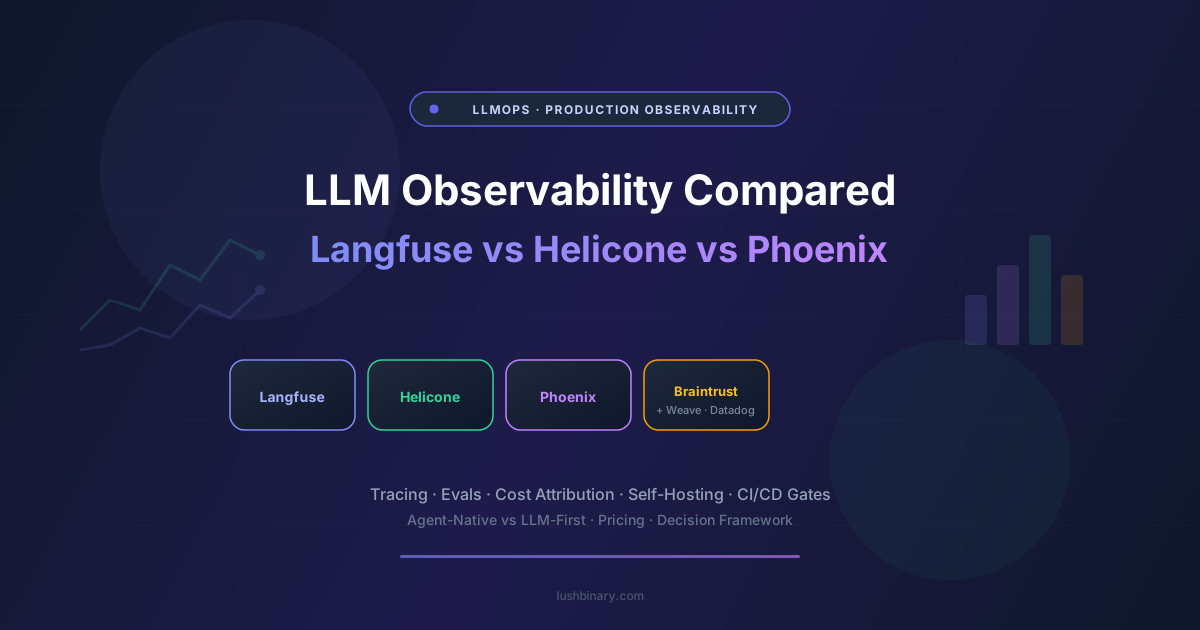
This guide compares the observability and evaluation tools production teams actually run: Langfuse, Helicone, Arize Phoenix, Braintrust, Weights & Biases Weave, and Datadog LLM Observability. We look at architecture, self-hosting, evals, pricing shape, and which fits which team. Pricing is sourced from vendor pages as of May 2026 and should be re-verified before you commit.
Table of Contents
- Why LLM Observability Is Different
- Three Architectures: Proxy, Platform, Eval-First
- Langfuse: The Open-Source Default
- Helicone: One-Line Drop-In Proxy
- Arize Phoenix: OpenTelemetry-Native and Self-Hostable
- Braintrust: Eval-First With CI/CD Gates
- Weights & Biases Weave: For ML-Heavy Teams
- Datadog LLM Observability: The Enterprise Default
- Head-to-Head Comparison Table
- Decision Framework
- What to Instrument First
- Why Lushbinary for LLM Observability
1Why LLM Observability Is Different
Traditional APM watches latency, error rates, and throughput. Those still matter for LLM apps, but they miss the failures that actually hurt: a response that is fast, returns HTTP 200, and is completely wrong. LLM observability has to capture quality, cost, and behavior, not just uptime.
- Quality is not a status code. You need evals, scoring, and human feedback loops to know if outputs are good, not just whether the call succeeded.
- Cost is per-token and compounds. Spend has to be attributable to a user, a prompt template, and a model version, or you cannot find the line item that is bleeding budget.
- Traces are multi-step. Agents and RAG chains span many calls. You need causal traces across steps, not isolated logs you correlate by hand.
- Behavior drifts. Provider model updates change outputs without a code change on your side. Regression evals catch this; uptime monitors do not.
Agent-native vs LLM-first
A useful distinction when evaluating tools: agent-native platforms capture the causal dependencies between steps in a multi-step agent, while LLM-first tools log independent events you must correlate yourself. If you are building agents, prioritize tools that model the trace tree, not just the call log.
2Three Architectures: Proxy, Platform, Eval-First
Understanding which architecture a tool uses tells you most of what you need to know about its trade-offs.
Drop-in proxy
Point your base URL at the proxy and get logging instantly. Fastest setup, minimal code change, but it sits in your critical request path.
Full platform / SDK
Instrument with an SDK for tracing, prompt management, datasets, and evals. More setup, more depth, often self-hostable.
Eval-first
Built around experiments and CI/CD eval gates. Best when you want to block a deploy that regresses output quality.
Most mature teams end up combining a proxy or platform for production tracing with an eval workflow for pre-deploy gates. They are complementary, not mutually exclusive.
3Langfuse: The Open-Source Default
Langfuse is the safest default for teams that want depth without vendor lock-in. It covers tracing, prompt versioning, datasets, and evaluations, supports a wide range of frameworks, and can be fully self-hosted or run as managed cloud. The combination of open source plus managed parity is why it appears at the top of so many shortlists.
Strengths
- Open source, fully self-hostable, no limits
- Tracing, prompts, datasets, and evals in one tool
- Broad framework and SDK support
- Managed cloud with a free tier
Weaknesses
- Self-hosting is real infrastructure to run
- Alerting less mature than enterprise APM
- Eval depth trails dedicated eval-first tools
Pricing shape: Free self-hosting; managed cloud has a free tier with usage-based paid plans (community reports cite an included monthly unit allowance with overage around $8 per 100k units). Confirm on Langfuse pricing. Best for: teams that want one open-source platform and the option to self-host.
4Helicone: One-Line Drop-In Proxy
Helicone is the fastest way to get observability live. Change your base URL, add a header, and every LLM call becomes an auditable event with cost, latency, and per-prompt breakdowns. For teams that want visibility today without an instrumentation project, it is hard to beat.
Strengths
- One-line integration, near-zero setup
- Per-prompt and per-user cost breakdowns
- Caching and rate limiting at the proxy
- Open source with self-host option
Weaknesses
- Proxy sits in your critical request path
- Eval and dataset tooling lighter than platforms
- Deep agent trace modeling less rich
Pricing shape: Free tier, with paid plans commonly reported starting around $79/month and usage-based scaling. Verify on Helicone pricing. Best for: teams that want production cost visibility and caching with minimal engineering effort.
5Arize Phoenix: OpenTelemetry-Native and Self-Hostable
Phoenix is the open-source observability tool from Arize, built around OpenTelemetry. If OTel portability and avoiding proprietary instrumentation are non-negotiable, Phoenix is the pick. It brings ML-grade rigor: tracing, evaluation, embedding analysis, and drift detection, with a clean self-hosting story.
Strengths
- OpenTelemetry-native, low lock-in
- Strong evaluation and drift analysis
- Free and open source, self-hostable
- Backed by Arize's enterprise platform
Weaknesses
- More ML-oriented learning curve
- Prompt management lighter than Langfuse
- Full enterprise features need Arize proper
Best for: teams that already use OpenTelemetry and want rigorous, portable observability without proprietary agents.
6Braintrust: Eval-First With CI/CD Gates
Braintrust is built around evaluation and experiment iteration. Its strongest feature is eval-gated deployment: run evals in CI and block a release that regresses output quality, the same way you block a merge on a failing test. It also exposes observability to IDE tools through an MCP server that Cursor, Claude Code, and VS Code can query directly.
Strengths
- Strongest CI/CD eval-gated deploy workflow
- Deep experiment and dataset tooling
- MCP server for IDE-native observability
- Generous free tier reported by users
Weaknesses
- Less of a self-host-everything story
- Production tracing is not the primary focus
- Paid tiers can climb for larger teams
Pricing shape: Free tier reported as generous (large monthly span and eval-run allowances), with paid plans commonly cited starting around $249/month. Best for: teams that treat eval quality as a release gate and iterate heavily on prompts.
7Weights & Biases Weave: For ML-Heavy Teams
If your organization already lives in Weights & Biases for model training and experiment tracking, Weave extends that world to LLM applications: tracing, evaluation, and comparison built into a platform your ML team already trusts. The integration value is the draw.
Strengths
- Tight fit if you already use W&B
- Strong experiment and comparison tooling
- Trusted by ML and research teams
Weaknesses
- Overhead if you are not already on W&B
- Less drop-in than a proxy
- Production cost dashboards less central
Best for: ML-heavy organizations standardized on Weights & Biases that want LLM observability in the same platform.
8Datadog LLM Observability: The Enterprise Default
For organizations already running Datadog across their stack, its LLM Observability product is the path of least resistance. It correlates LLM traces with the rest of your infrastructure metrics, logs, and APM in one pane, with the enterprise security, SSO, and support an existing Datadog contract already covers.
Strengths
- One pane with the rest of your observability
- Enterprise security, SSO, and support
- Correlate LLM traces with infra and APM
Weaknesses
- Cost adds up on top of existing Datadog spend
- Less LLM-specialized than focused tools
- Not open source, no self-host
Best for: enterprises already standardized on Datadog that value one unified observability platform over best-of-breed.
9Head-to-Head Comparison Table
| Tool | Architecture | Self-host | Best for |
|---|---|---|---|
| Langfuse | Full platform | Yes, no limits | OSS default, no lock-in |
| Helicone | Drop-in proxy | Yes | Fast cost visibility |
| Arize Phoenix | OTel platform | Yes | OTel portability |
| Braintrust | Eval-first | Partial | CI/CD eval gates |
| W&B Weave | Platform / SDK | Managed | ML-heavy teams |
| Datadog LLM Obs | Enterprise APM | No | Existing Datadog shops |
Feature sets and pricing evolve quickly in this category. Confirm specifics against each vendor's current documentation.
10Decision Framework
- Want open source and the option to self-host: Langfuse, or Arize Phoenix if OpenTelemetry adherence is the priority.
- Need visibility today with minimal effort: Helicone as a drop-in proxy.
- Treat output quality as a release gate: Braintrust for eval-gated CI/CD.
- Already standardized on a platform: Weave if you live in Weights & Biases, Datadog LLM Observability if you live in Datadog.
- Building multi-step agents: prioritize agent-native trace modeling over flat call logs.
11What to Instrument First
Whatever tool you choose, the order of instrumentation is similar. Capture the trace, attach cost and metadata, then layer evals on top.
If you are still designing the application itself, our AI-native SaaS architecture guide covers where observability hooks into the broader system.
12Why Lushbinary for LLM Observability
We instrument LLM applications and agents for clients so they can see cost, quality, and behavior before users do. We pick the tool that fits your stack and constraints rather than defaulting to whatever is loudest, and we wire evals into CI so quality regressions get caught at the PR, not in production.
What we typically deliver:
- Tracing and cost attribution wired into Langfuse, Helicone, or Phoenix based on your needs
- Self-hosted observability for data-residency or air-gapped teams
- Eval suites and CI/CD quality gates for prompt and model changes
- Cost dashboards broken down by user, feature, and model
- Drift alerts for provider model updates that change behavior
Free Consultation
Flying blind on LLM cost and quality? Lushbinary sets up observability and eval pipelines tuned to your stack so you catch regressions before your users do, no obligation.
Sources
- Langfuse pricing
- Helicone pricing
- Arize Phoenix
- Braintrust
- Weights & Biases Weave
- Datadog LLM Observability
Content was rephrased for compliance with licensing restrictions. Pricing and feature availability sourced from official vendor pages as of May 2026 and may change. Always verify on the vendor's site before purchase.
Frequently Asked Questions
What is the best LLM observability tool in 2026?
It depends on your constraints. Langfuse is the safest open-source default with self-host parity, Helicone is fastest to set up as a drop-in proxy, Arize Phoenix is best for OpenTelemetry portability, Braintrust leads on CI/CD eval gates, and Datadog LLM Observability fits teams already on Datadog. Many teams combine a tracing tool with an eval-first workflow.
What is the difference between LLM observability and traditional APM?
Traditional APM tracks latency, errors, and throughput. LLM observability adds quality (via evals and feedback), per-token cost attribution, multi-step agent traces, and drift detection for provider model updates. A response can be fast and return HTTP 200 while being completely wrong, which APM alone cannot detect.
Which LLM observability tools can I self-host?
Langfuse, Helicone, and Arize Phoenix are open source and self-hostable. Langfuse offers the fullest self-host platform with no limits, Phoenix is OpenTelemetry-native, and Helicone can be self-hosted as a proxy. Datadog LLM Observability is managed only, and Braintrust is partially self-hostable.
How much do LLM observability platforms cost?
Self-hosting open-source tools costs only your infrastructure. Managed plans vary: Langfuse and Helicone have free tiers with usage-based paid plans (Helicone paid commonly reported around $79/month), Braintrust paid plans are commonly cited around $249/month, and Datadog adds to your existing Datadog spend. Verify current pricing on each vendor page.
What is eval-gated deployment?
Eval-gated deployment runs automated evaluations in CI and blocks a release if output quality regresses, the same way a failing unit test blocks a merge. Braintrust is built around this workflow. It is the most reliable way to stop a prompt or model change from quietly degrading your product.
What is the difference between agent-native and LLM-first observability?
Agent-native tools capture the causal dependencies between steps in a multi-step agent so you can see the full trace tree. LLM-first tools log independent call events that you must correlate manually. If you are building agents, prefer tools that model the trace tree.
See What Your LLM App Is Really Doing
We wire up tracing, cost attribution, and eval gates tuned to your stack so quality and spend stay under control.
Ready to Build Something Great?
Get a free 30-minute strategy call. We'll map out your project, timeline, and tech stack - no strings attached.
Prefer email? Reach us directly: